How We Made Data Count!
Key to this has been the rendering of statistical process control measures at scale across the organisation. In displaying evolving information in this way, we are now able to support effective and responsive decision-making in line with the NHSE initiative Making Data Count.
Problem
With so much data available across the NHS, managers and clinical staff can feel overwhelmed and unsure of where to look or what can be reliably used to make day to day and longer-term decisions.
It was important for us to have a ‘front door’ through which staff could locate information quickly without additional logins or having to remember where things were. Fundamental to this would be the ability to utilise statistical analysis to aid effective decision making.
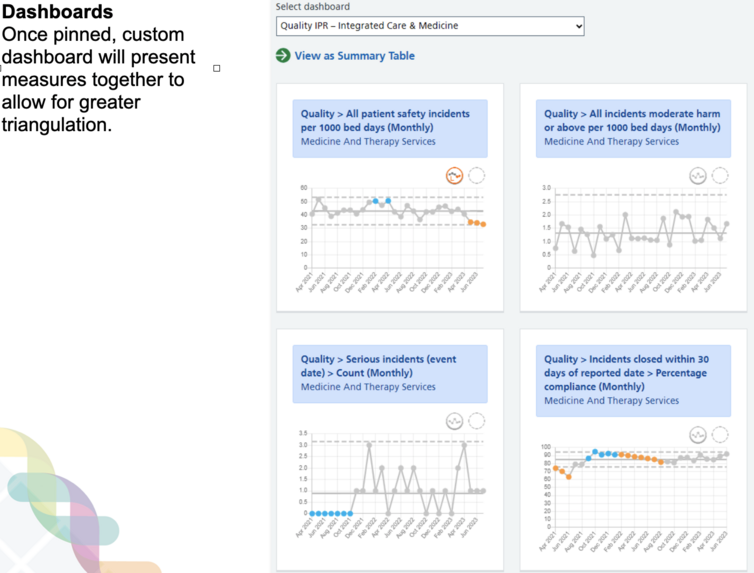
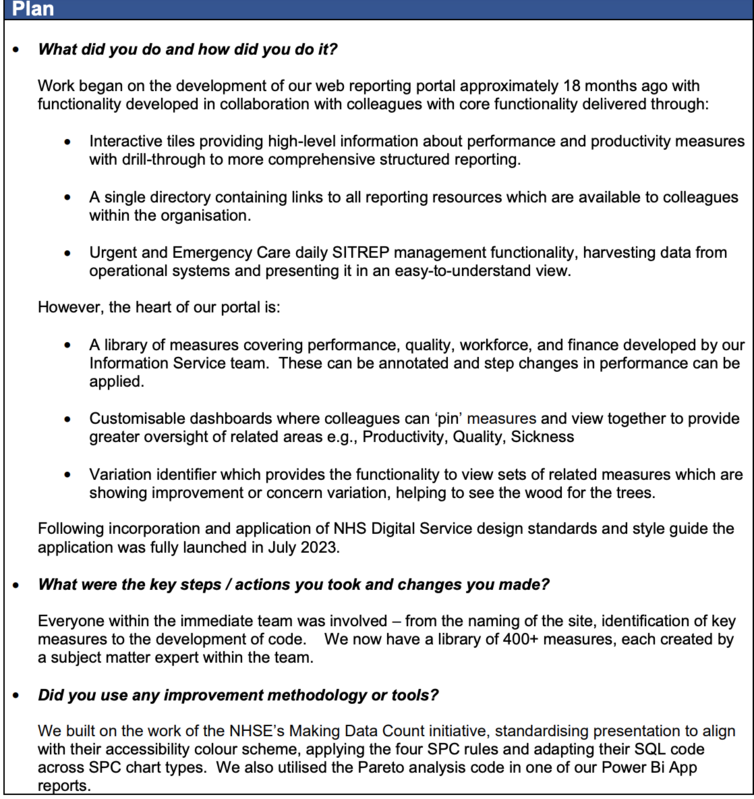
While we were keen to roll out the principles around the Making Data Count initiative, the current tools – Excel and Power Bi – where limited when scaling up. We also wanted end-users to be able to quickly establish their own customisable dashboards; a pick and mix from a library of established measures.
To be successful we knew that we needed to be responsive to what services and staff needed.
Aim
We wanted a single destination on our intranet where staff could:
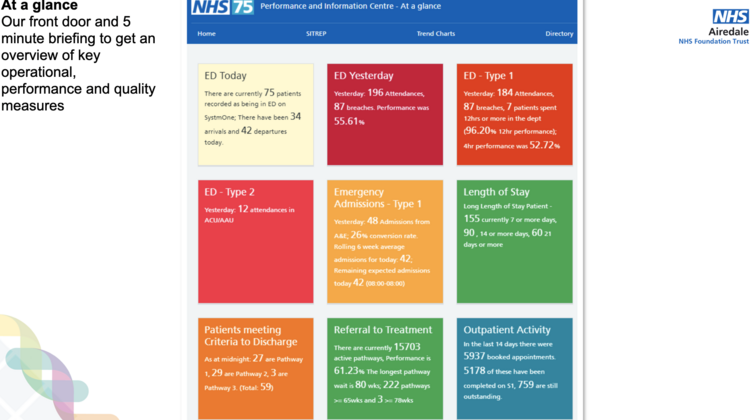
• At a glance find out everything they needed to know about the organisation’s operational performance. We consider this our 5-minute briefing where colleagues can understand pressures within operational areas.
• Gain oversight of trends using robust statistical analysis so that appropriate interventions can
be planned.
• Explore (Power Bi) Apps, reporting links and useful resources in a single easy to access Directory.
Statistical process control identifies significant variation and avoids overaction. Fundamentally we should be about good decision making because this underpins patient experience, staff satisfaction, health outcomes and costs. Staff can quickly access and better use the available data through the SPC prism to support effective decision.
Pareto and correlation analysis has been utilised to consider inpatient, outpatient and diagnostic activity (including cancer and specialised services) to understand the delivery themes (initially for adults). This is in support of potential health inequality actions.
One of the most exciting aspects of SPC is that the system can give assurance as to whether a target is being met or not. Managers and clinicians can implement actions or re-design a system based on reliable intelligence. The embedding of Making Data Count principles has extended to directorate, divisional and Trust reports with discussion around performance now more focussed with a move towards action-driven narrative when planning recovery or transformation.
The business intelligence leads presented this work at the Making Data Count Analyst Network July 2023. This is a national network established by NHSE’s Making Data Count team to champion its initiative and share good practice. Feedback from attendees at the meeting was overwhelmingly positive and supportive.
You can read and download the full project report HERE
Click on the image below to read and download an engaging presentation