What was the issue? Aintree was in the lowest quartile of Trusts in relation to patient experience feedback from the national CQC mandated inpatient experience surveys; we set a Quality Improvement Strategy (2014-17) target for Aintree to be in the top 25% of organisations by 2017 . We needed to establish a timely process for relaying feedback to the appropriate decision makers in the Trust which supported them to act upon the needs and views of our patients and their carers/families.
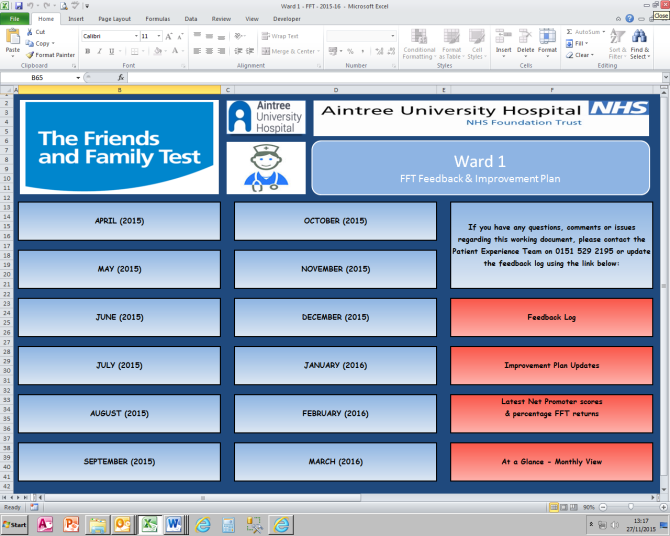
What was Aintree’s solution? Aintree developed a Patient Feedback Shared Improvement Dashboard, a simple, cost neutral yet effective and innovative shared information gateway enabling a range of users to learn from, understand and act upon patients/carer feedback and also compare their performance with other areas in the Trust.
It provides our leadership teams with a timely process for disseminating feedback and offers a real time snap shot of key themes, performance metrics and compliments from our service users through a range of sources. Positive and constructive comments from the Friends & Family Test (FFT), social media and other sources of feedback are fed into the Dashboard enabling constructive comments to be pulled directly into a local Patient Experience Improvement Plan.
Wards/departments are required to provide evidence of patient feedback related improvements as part of the Trust’s ward/department quality assurance system – the Aintree Assessment and Accreditation (AAA) Framework. Aintree has recently expanded the use of the Dashboard to the catering, estates and pharmacy departments.
What outcomes have we seen? Aintree chose two key measures to monitor the success of this initiative as both were our largest sources of direct patient feedback.
Family and Friends Test (% likely to recommend your Trust) - since launch of the dashboard, Aintree has consistently performed higher than both Merseyside/Cheshire & national averages when asking inpatients if they would recommend the care and service they receive.
The mandatory National Inpatient Survey (summer 2014) cited Aintree as the most improved Trust (of 78 participating) when measured against the 2013 survey. The improvements were noted to be in relation to cleanliness, confidence in doctors, explanations given ahead of surgical procedures, quality of food, emotional support provided by staff, and discussions about health and social care needs prior to discharge from hospital.
At the time of posting Aintree was just outside (25.6%) the aspirational target of 25% we set in 2014. We are building upon the results of the 2014 survey by targeting improvement on areas of weakness. Aintree continued to show significant improvements to patient experience from those patients surveyed in December 2014 and May/July 2015.
Our work has been recognised nationally in a number of ways; the Picker Institute has been keen to understand how we have achieved the improvement and other Trusts have adopted out dashboard or visited to find out more.
We achieved finalist status in the 2016 Patient Experience Network National Awards.
Next steps The dashboard is constantly evolving. We have now introduced a ‘feedback log’ facility, allowing users to add their own views to enable continuous improvement. The improvements in patient experience have been recognised nationally and the PICKER Institute have visited the organisation to undertake a research study relating to how our improvements have been achieved.
Contact details: Matthew Norris, Data Support Officer. [email protected] or Telephone: 0151 529 2195 Anna Morris, Lead Nurse for Patient Experience. [email protected] or Telephone: 0151 529 8624